Portsmouth and Oxford are both historic English cities with distinct travel patterns, but they pursue different strategies for transport and parking. Portsmouth leans heavily on bus‑centric corridors, harbour‑based ferries, and a dense network of resident parking zones, while Oxford focuses on mass‑transit corridors, Park‑and‑Ride hubs, and stringent low‑emission and filtered‑traffic controls in the city centre. This article compares their core policies, mechanisms, and practical implications for residents and visitors, using hard data and policy documents to support a Portsmouth vs Oxford analysis.
- What is the core difference between Portsmouth and Oxford transport policy?
- How do Portsmouth and Oxford regulate parking in residential areas?
- How many resident parking zones exist in Portsmouth versus Oxford?
- How do parking prices and visitor‑parking rules differ?
- How do bus and rapid‑transit strategies differ?
- How do zero‑emission and low‑emission policies compare?
- How do both cities manage city‑centre traffic and filtered‑traffic schemes?
- How do walking and cycling policies differ?
- What are the broader implications of these policy choices?
- How will these policies evolve over the next decade?
What is the core difference between Portsmouth and Oxford transport policy?
Portsmouth and Oxford both aim to reduce car dependency, but they deploy very different levers. Portsmouth builds on a compact, island‑city geography with a 2026–2040 Public Transport Strategy that prioritises bus‑based rapid‑transit corridors, improved rail and ferry links, and a city‑wide zero‑emission bus‑fleet ambition. Oxford, by contrast, operates in a constrained historic core and relies on a 20‑year Oxford Transport Strategy (OTS) that combines Park‑and‑Ride, a planned Bus Rapid Transit (BRT) network, rail‑capacity upgrades, and aggressive traffic‑demand‑management measures such as filtered‑traffic and low‑emission zones.
Portsmouth’s approach is more “corridor‑first”: it seeks to make bus journeys faster and more reliable through the South East Hampshire Rapid Transit (SEHRT) network, targeted bus‑priority schemes, and reinforced bus‑rail‑ferry integration. Oxford’s approach is more “place‑first”: it treats the city centre as a finite space, caps many car movements, and channels growth onto Park‑and‑Ride and BRT corridors.
In practice, this means that Portsmouth residents face more bus‑oriented engineering (lanes, priority signals, and hubs), whereas Oxford residents encounter more regulatory controls (filters, low‑emission rules, and limited parking) layered on top of a bus‑ and rail‑based backbone.
How do Portsmouth and Oxford regulate parking in residential areas?
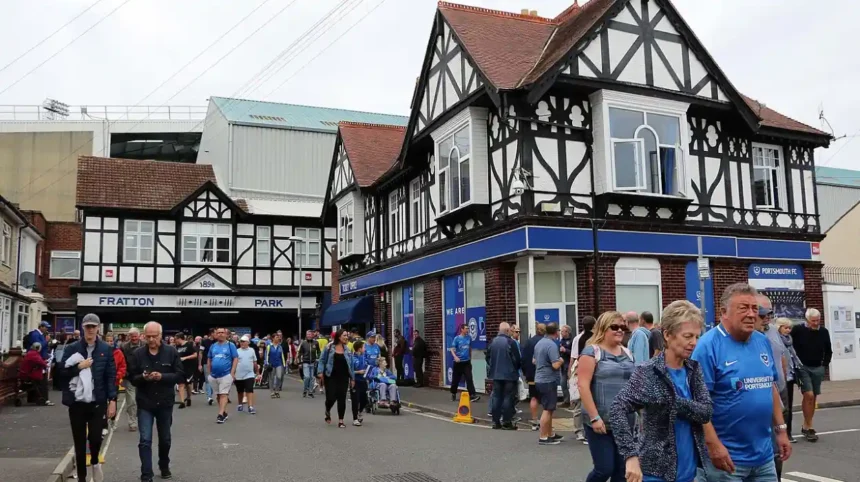
In Portsmouth, residential parking is governed by a city‑wide resident parking‑zone framework with over 40 active zones and a detailed Parking Policy Statement. Each zone is mapped, and most operate 7 days a week, 24 hours a day, with free parking periods of 1–3 hours for visitors depending on the ward (for example 1 hour in some zones, 2 hours in others, and 3 hours in West Southsea‑type schemes).
In contrast, Oxford’s residential‑parking model is more loosely tied to the Oxford Transport Strategy’s broader travel‑demand‑management agenda. The city relies less on ubiquitous on‑street resident‑permit schemes and more on Park‑and‑Ride, controlled‑entry filters, and limited‑permit parking in specific low‑emission or consolidated‑traffic areas.
Portsmouth zones also feature visitor scratchcards and digital permits (for example via RingGo), multi‑hour leniency windows, and strict rules about where permits can and cannot be used (such as excluding certain limited‑waiting bays). Oxford’s residential‑parking conversation is more policy‑led: it focuses on discouraging commuter‑car ownership through employer‑parking pricing and zoning‑linked constraints than on granular on‑street permit maps.
How many resident parking zones exist in Portsmouth versus Oxford?
Portsmouth currently lists more than 40 named resident parking zones, each with defined streets, operating hours, and free‑parking entitlements for non‑permit holders. These include AA–NA‑style designations covering areas such as North Fratton, Cosham, Southsea, and Old Portsmouth.
Oxford does not publish an equivalent, zone‑by‑zone resident‑parking map in the same way. Instead, parking‑supply and demand are managed through the OTS’s travel‑demand‑management component, which includes Park‑and‑Ride capacities, inner‑city parking‑capping, and workplace‑parking‑levy‑type proposals that indirectly shape where residents choose to park.
For a direct Portsmouth vs Oxford comparison, Portsmouth’s system is more visible and day‑to‑day granular for residents, while Oxford’s is more embedded in overarching transport‑planning documents and performance‑based controls (such as Park‑and‑Ride occupancy and congestion thresholds).
How do parking prices and visitor‑parking rules differ?
Portsmouth’s resident parking‑zone table sets out a clear hierarchy of visitor entitlements. In many zones visitors receive 1 hour free, in some areas 2 hours, and in others up to 3 hours, with the proviso that metered or Pay‑and‑Display bays still require coins or scratchcards even inside a resident‑permit area. Third permits are often explicitly not available, which caps household‑level on‑street parking.
In Oxford, parking‑price policy is shaped more by the city‑centre and Park‑and‑Ride economies. The OTS references a mix of controlled‑parking bays, Park‑and‑Ride tariffs, and eventual workplace‑parking‑levy mechanisms that push employers and car‑owning employees to choose Park‑and‑Ride or public‑transit‑only options.
From a Portsmouth vs Oxford standpoint, Portsmouth is more “permitted parking” and Oxford is more “managed parking plus demand‑levy.” This means a Portsmouth visitor tends to see a block‑by‑block code (e.g., 1–3 hours free with a scratchcard), while an Oxford visitor is more likely to encounter Park‑and‑Ride‑first pricing, short‑stay bays, and restricted‑entry areas around the city centre.
How do bus and rapid‑transit strategies differ?
Portsmouth’s 2026–2040 Public Transport Strategy squarely targets bus‑based rapid‑transit. It defines the South East Hampshire Rapid Transit (SEHRT) as a key corridor product, with additional bus‑priority schemes, traffic‑signal‑priority, and improved cross‑street bus infrastructure. The strategy also commits to a fully zero‑emission bus fleet over time and more integrated bus‑rail‑ferry‑taxi hubs.
Oxford’s OTS also elevates buses, but wraps them into a broader mass‑transit bundle. The OTS envisages a 2035‑vision mass‑transit system composed of three modes: rail, Bus Rapid Transit (BRT), and conventional buses and coaches. The BRT is designed to provide “tram‑like” standards (dedicated corridors, high‑frequency services, and modern zero‑emission buses) along the busiest radial routes, while the existing Park‑and‑Ride and intercity bus services remain foundational.
In a Portsmouth vs Oxford frame, Portsmouth’s bus‑strategy is more about upgrading existing corridors and service‑reliability, while Oxford’s is more about building a new, branded BRT spine and protecting Park‑and‑Ride as the default gateway for car‑based trips.
How do zero‑emission and low‑emission policies compare?
Portsmouth’s 2026–2040 strategy explicitly targets a fully zero‑emission bus fleet, supported by the county‑level Bus Service Improvement Plan and national funding streams. This aligns with wider South Hampshire and Solent‑region efforts to reduce nitrogen dioxide and particulate emissions, but there is no dedicated “zero‑emission zone” in the city centre like Oxford’s.
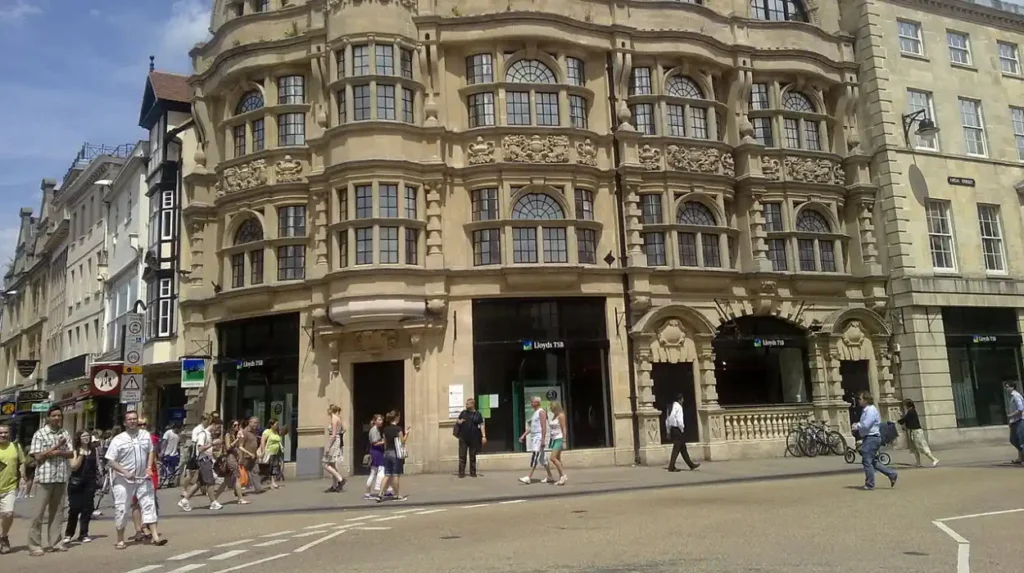
Oxford, by contrast, has a Zero Emission Zone (ZEZ) introduced in 2022 covering the core city area, which restricts higher‑pollution vehicles during certain hours and links to the wider Air Quality Management Area with targets for nitrogen dioxide and carbon dioxide reductions. The OTS also mandates that taxis and private‑hire vehicles meet ultra‑low‑emission standards by 2026, further tightening the city’s low‑emission envelope.
For a Portsmouth vs Oxford reader, the distinction is structural: Portsmouth is pushing for system‑level zero‑emission buses, while Oxford is layering low‑emission road‑space controls (filters, ZEZ, taxi standards) on top of a bus‑ and Park‑and‑Ride‑centric network.
How do both cities manage city‑centre traffic and filtered‑traffic schemes?
Oxford’s OTS devotes a full “Managing traffic and travel demand” chapter to techniques such as traffic‑control points, road‑user‑charging pilots, Park‑and‑Ride‑driven demand‑management, and filtered‑traffic measures. The city’s Zero Emission Zone and proposed traffic filters (which block certain private‑car movements while allowing buses, taxis, and emergency vehicles) are designed to cap congestion and air‑pollution in the historic core.
Portsmouth, as a compact island city, does not currently operate equivalent filtered‑traffic schemes in the same style. Instead, it manages congestion through bus‑priority corridors, signal‑timing, and parking‑control measures, such as resident‑only bays and limited‑waiting lengths. The city’s constrained geography – effectively bounded by the Solent and the M275/M27–M3 motorway wedge – means policy‑makers lean on network‑level controls and modal‑shift rather than explicit city‑centre filters.
In a Portsmouth vs Oxford comparison, Oxford’s approach is more prescriptive and regulatory in the centre, while Portsmouth’s is more infrastructural and pricing‑based, emphasising shift from car to bus, rail, and ferry.
How do walking and cycling policies differ?
Portsmouth’s 2026–2040 strategy includes modern, accessible infrastructure for pedestrians and cyclists, such as bus‑shelter‑level information, protected crossings, and improved inter‑modal links at key hubs. The city’s small geographic footprint naturally supports short‑trip walking and cycling, but the policy emphasis is on integrating non‑motorised modes into the bus‑centric framework rather than building a stand‑alone comprehensive cycle‑network.
Oxford’s OTS contains a dedicated “Walking and Cycling” section that sets out a city‑wide walking and cycling network, with continuous pedestrian and cycle routes, upgraded public‑realm spaces, and cycling‑specific engineering. The strategy explicitly links these improvements to Park‑and‑Ride and BRT corridors, so that walkers and cyclists can feed into the main mass‑transit spine.
From a Portsmouth vs Oxford perspective, Oxford’s walking‑and‑cycling policy is more spatially explicit and network‑planned, while Portsmouth’s is more embedded in a broader public‑transport‑integration narrative. Both acknowledge the importance of active travel, but Oxford’s documents assign it a distinct, high‑priority strand.
What are the broader implications of these policy choices?

For Portsmouth vs Oxford, the long‑term effects unfold in three main domains: air‑quality and decarbonisation, congestion and journey‑time reliability, and social equity. Portsmouth’s bus‑centric, permit‑based parking model tends to support gradual modal‑shift and localised parking control, but it does not yet replicate Oxford’s hard traffic‑capping and low‑emission tools.
Oxford’s mix of Park‑and‑Ride, BRT, ZEZ, and filtered‑traffic controls is explicitly designed to keep traffic volumes flat despite substantial projected growth in jobs and homes. The OTS’s growth‑forecasts point to tens of thousands of extra trips by 2031, and the system is calibrated to prevent those from becoming extra car‑trips.
Across both cities, the policy direction is toward reduced car‑dominance, but Oxford’s approach is more interventionist and legally tightened, while Portsmouth’s is more service‑improvement and pricing‑based. This difference shapes how residents experience restrictions, how visitors choose to arrive, and how development is directed toward public‑transport‑rich corridors.
How will these policies evolve over the next decade?
Portsmouth’s 2026–2040 strategy contains a staged action plan tying bus‑priority projects, SEHRT‑rollout, and zero‑emission‑fleet targets to specific years and funding milestones. The city also continues to expand its resident‑parking‑zone programme, with new orders taking effect in areas such as North Fratton and other suburban wards.
Oxford’s OTS adopts a 20‑year horizon, with the 2035‑vision for mass transit, Park‑and‑Ride, BRT, and rail‑upgrades serving as a rolling planning framework. The document anticipates step‑by‑step upgrades to Oxford Station, Park‑and‑Ride facilities, and corridor‑level BRT infrastructure, meanwhile using traffic‑management and parking‑controls to smooth the transition.
In a Portsmouth vs Oxford context, both cities are moving toward higher‑quality, lower‑emission, more transit‑centric systems, but they do so with different policy instruments. Portsmouth emphasises bus‑service reliability and on‑street parking‑management, while Oxford emphasises Park‑and‑Ride‑anchored networks, BRT, and city‑centre traffic‑capping. These contrasts will continue to define the lived experience of transport and parking in each city for the rest of the decade.
What are the different means of transport and their uses?
Different means of transport include walking, cycling, buses, cars, trains, and ferries. Each serves distinct purposes such as short‑trip mobility (walking, cycling), commuter travel (buses, trains), private flexibility (cars), and cross‑water routes (ferries), all relevant to understanding the transport context in the article “Portsmouth vs Oxford: How Do Their Transport and Parking Policies Compare?”
Why is private transport better?
Private transport, such as cars, offers greater convenience, door‑to‑door service, and scheduling flexibility compared with fixed‑timetable public options. However, in the context of “Portsmouth vs Oxford: How Do Their Transport and Parking Policies Compare?”
What are the five disadvantages of transport?
Transport can cause congestion, air and noise pollution, high operating and infrastructure costs, accident risks, and unequal access for people without vehicles or mobility limitations.
How far should a 70 year old woman walk each day?
Most health guidelines suggest older adults aim for about 7,000–10,000 steps per day, or roughly 3–5 miles, depending on fitness and medical advice. In the context of “Portsmouth vs Oxford: How Do Their Transport and Parking Policies Compare?”, cities are improving pedestrian‑friendly infrastructure so that walking becomes a viable and safer alternative to driving for residents of all ages.
What are the problems with rail transportation?
Rail transport can be expensive to build and maintain, inflexible in route changes, and subject to congestion, delays, and limited coverage in rural or low‑density areas.