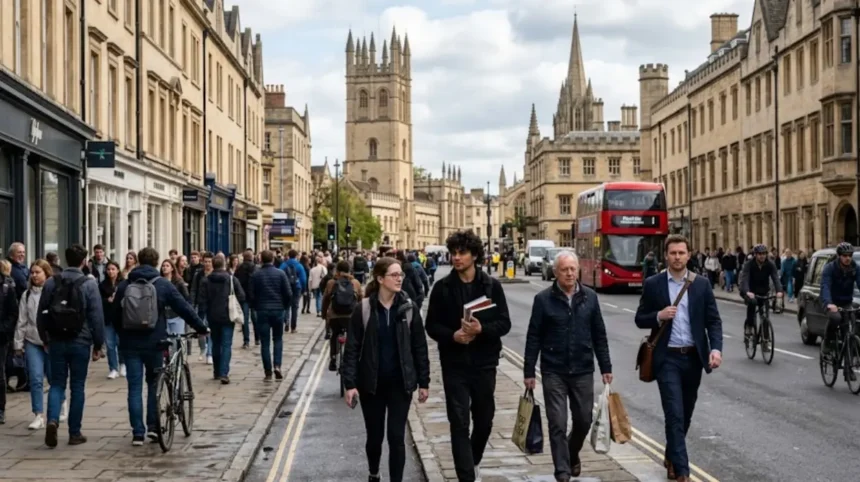
The city of Oxford represents one of the most demographically unique urban areas in the United Kingdom. Located in the county of Oxfordshire in South East England, Oxford functions as a regional economic engine, a historic academic hub, and a dense residential community. Analyzing the population dynamics of Oxford requires evaluating official census data, municipal estimates, student enrollment figures, and socio-economic indicators published by government authorities. Oxford Daily provides this comprehensive analysis of Oxford’s demographic structure, historical growth trajectories, ward-level distribution, and long-term population projections.
- What Is the Total Population of Oxford in the UK?
- Official Office for National Statistics Population Figures
- Population Density and Geographic Boundaries
- How Has the Population of Oxford Changed Historically?
- Historical Growth from Medieval Times to the Industrial Era
- Twenty-First Century Population Expansion and Census Comparisons
- What Is the Age Distribution of the Oxford Population?
- How Do University Students Impact Oxford Demographics?
- Student Enrollment Figures across Higher Education Institutions
- Term-Time Population Fluctuations and Spatial Distribution
- What Is the Ethnic and Cultural Diversity of Oxford?
- How Are Population and Housing Distributed Across Oxford Wards?
- High-Density Urban Neighbourhoods and Residential Zones
- Household Composition and Housing Supply Constraints
- What Are the Economic and Social Implications of Oxford Demographic Trends?
- What Are the Future Population Projections for Oxford?
What Is the Total Population of Oxford in the UK?
According to the Office for National Statistics mid-2023 estimates, the total resident population of Oxford is 165,200 people. The 2021 UK Census recorded 162,100 residents, representing a 6.7 percent growth from 151,900 residents recorded during the 2011 Census.
Official Office for National Statistics Population Figures
The primary authority for demographic statistics in the United Kingdom is the Office for National Statistics (ONS). ONS conducts the national population census every ten years and issues annual mid-year population estimates between census dates. The 2021 Census established Oxford’s official resident headcount at 162,100 individuals. Subsequent ONS mid-year estimates released in July 2024 revised the mid-2023 population figure upward to 165,200 individuals.
Population growth in Oxford between 2011 and 2021 equaled 6.7 percent, adding 10,200 residents to the local authority area. This rate of population increase closely matched the national growth rate for England, which stood at 6.6 percent over the same decade. However, Oxford’s growth lagged behind the broader county of Oxfordshire, which expanded by 10.9 percent during the same decade. The total population figure encompasses all usual residents who live in the local authority boundary for 12 months or longer, including domestic and international university students residing in the city during term time.
Population Density and Geographic Boundaries
Oxford City Council administers an administrative boundary covering an area of 45.6 square kilometers (17.6 square miles). This defined boundary creates a high population density compared to neighboring administrative districts in Oxfordshire.
In the 2021 Census, Oxford recorded a population density of 3,555 people per square kilometer. This equates to approximately 25.4 individuals per football-pitch-sized area of land. In contrast, the surrounding district of Vale of White Horse maintains a density of 240 people per square kilometer, while West Oxfordshire maintains 160 people per square kilometer. Oxford stands as the most densely populated non-metropolitan local authority district in the South East region of England. Tight administrative boundaries combined with strict spatial planning constraints establish intense competition for physical land across the city.
How Has the Population of Oxford Changed Historically?
Oxford evolved from a Saxon fortified borough with several thousand residents in the tenth century into a city of 151,900 residents by 2011. The population reached 162,100 in 2021 and 165,200 by 2023 due to expanding educational and industrial sectors.
Historical Growth from Medieval Times to the Industrial Era
The demographic history of Oxford spans over one thousand years of documented settlements. Alfred the Great established Oxford as a fortified burh in the late ninth century to defend Wessex against Danish incursions. The Domesday Book of 1086 recorded approximately 1,000 property units, indicating a population of roughly 5,000 inhabitants.
The establishment of the University of Oxford in the twelfth century transformed the social and economic composition of the town. By 1300, the population expanded to approximately 10,000 people. The Black Death of 1348 reduced the population by nearly half. Oxford experienced steady recovery over the early modern period, reaching an estimated 12,000 residents by the end of the seventeenth century.
The first official UK Census in 1801 recorded Oxford’s population at 11,941 residents. The nineteenth century brought industrialization, canal transport, and railway connections to Oxford. Three primary structural changes drove rapid population growth during the nineteenth century:
- The expansion of printing and publishing institutions, including Oxford University Press.
- The growth of municipal governance and public health service infrastructure.
- The physical expansion of residential housing into suburban zones like Jericho, Summertown, and Cowley.
By 1901, the population reached 49,336 residents.
Twenty-First Century Population Expansion and Census Comparisons
The twentieth century introduced automotive manufacturing to Oxford. William Morris established Morris Motors in Cowley in 1912, transforming eastern Oxford into an industrial manufacturing center. By 1951, Oxford’s resident population reached 98,675.
During the twenty-first century, Oxford shifted from legacy manufacturing toward high-technology industries, biotechnology, research institutions, and global higher education. Data from modern national censuses document this demographic trajectory:
- The 2001 Census recorded 134,248 residents in Oxford.
- The 2011 Census recorded 151,900 residents, marking a 13.1 percent increase over ten years.
- The 2021 Census recorded 162,100 residents, marking a 6.7 percent increase over ten years.
The population trajectory shows consistent expansion, supported by international migration, steady student intakes, and expansion within the healthcare and life science sectors.
What Is the Age Distribution of the Oxford Population?
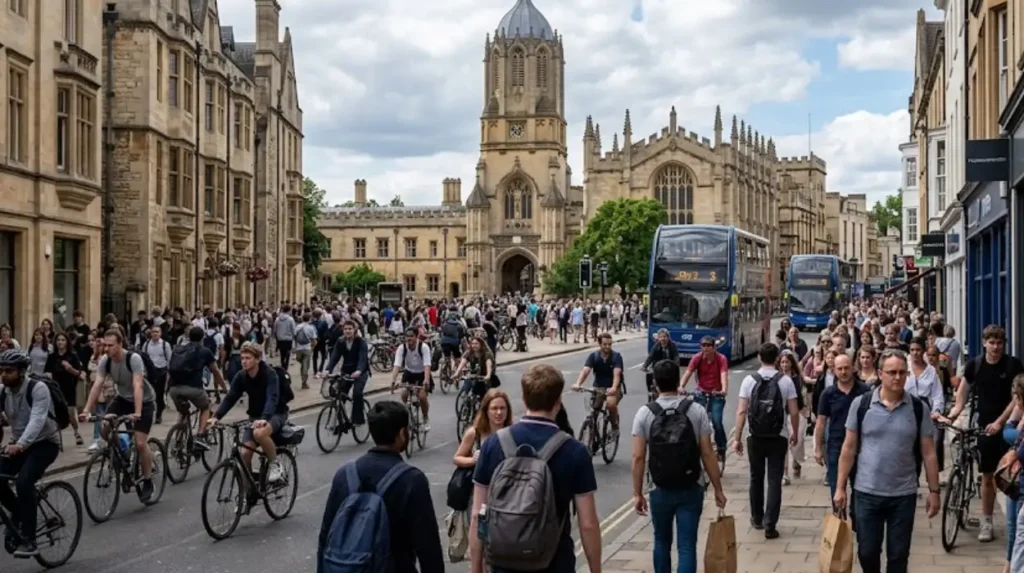
Oxford has a median age of 31 years, making it the youngest local authority area in the South East region of England. Residents aged 18 to 29 years constitute over 30 percent of the total population due to university enrollment.
The Dominance of Young Adult Demographics
The age profile of Oxford diverges sharply from regional and national averages. The 2021 Census established that the median age in Oxford was 31 years. This figure is lower than the median age for the South East region, which stands at 41 years, and lower than the median age for England as a whole, which stands at 40 years.
The high concentration of young adults shapes the population pyramid of the city. Individuals aged between 18 and 24 years represent 22 percent of all residents. Individuals aged 25 to 34 years represent an additional 16 percent of the population. The primary driver of this demographic shape is the continuous influx of young adults attending tertiary educational institutions or entering early-stage research and professional careers.
Structural Differences in Elderly and Dependent Age Groups
While young adults dominate the demographic headcount, children and elderly residents display distinct trendlines across Oxford.
Between the 2011 Census and the 2021 Census, specific age bands registered structural shifts:
- Early Childhood (Ages 0 to 4 years): Decreased by 22.9 percent, dropping by over 2,100 children.
- School-Age Children (Ages 5 to 17 years): Maintained stable numbers, accounting for approximately 14 percent of the total population.
- Working-Age Adults (Ages 50 to 64 years): Increased by 22.8 percent, adding approximately 4,300 residents.
- Older Residents (Ages 65 years and over): Account for 12.1 percent of the population, a significantly lower proportion than the England national average of 18.6 percent.
The reduction in children aged 0 to 4 years reflects high housing costs and limited family home availability within city boundaries, prompting young families to relocate to suburban towns outside Oxford.
How Do University Students Impact Oxford Demographics?
Full-time university students comprise 34,945 residents, representing approximately 22 percent of Oxford’s total population. University enrollment drives significant seasonal population spikes during academic terms and creates concentrated high-density student housing areas across specific city wards.
Student Enrollment Figures across Higher Education Institutions
Oxford hosts two major higher education institutions: the University of Oxford and Oxford Brookes University. Combined student enrollment data from the Higher Education Statistics Agency (HESA) and ONS mid-2023 estimates confirm that 34,945 full-time students live in Oxford during academic terms.
The University of Oxford enrolls approximately 26,000 students across its 39 constituent colleges and permanent private halls. Oxford Brookes University enrolls approximately 16,000 full-time undergraduate and postgraduate students across its Headington and Marston campuses. Together, full-time students account for 22 percent of the city’s total resident population, ranking Oxford among the highest student-density cities in the United Kingdom.
Term-Time Population Fluctuations and Spatial Distribution
The student population creates a seasonal demographic cycle. Academic terms run across three periods: Michaelmas term (October to December), Hilary term (January to March), and Trinity term (April to June). During vacation periods in July, August, September, and late December, thousands of undergraduate students vacate university accommodation and return to home addresses outside the city.
Student accommodation is distributed across three main residential configurations:
- University Colleges and Halls: Purpose-built residential facilities housing undergraduates directly within college grounds in Central Oxford.
- Purpose-Built Student Accommodation (PBSA): Large commercial student housing complexes located along key transport corridors such as Botley Road, Cowley Road, and Marston Road.
- Houses in Multiple Occupation (HMOs): Private residential dwellings converted to accommodate three or more unrelated individuals, concentrated in the wards of St Clement’s, East Oxford, and Cowley.
This spatial clustering means specific electoral wards exhibit student population densities exceeding 40 percent during academic terms.
What Is the Ethnic and Cultural Diversity of Oxford?
International residents make up 35 percent of Oxford’s population, with 37.7 percent of residents born outside England. Ethnic minorities account for 29.3 percent of residents, with Asian and Mixed ethnic groups forming the largest non-white demographic populations in Oxford.
Breakdown of Ethnic Group Classifications
Data from the 2021 Census demonstrates that Oxford is an ethnically diverse local authority. Non-white ethnic groups account for 29.3 percent of the resident headcount, making Oxford the second most ethnically diverse city in the South East region of England, behind Slough.
According to the official ONS Census classifications:
- White: 70.7 percent of residents (including 53.5 percent White British, 1.4 percent White Irish, and 15.8 percent Other White).
- Asian or Asian British: 12.4 percent of residents, with Pakistani (3.4 percent), Indian (2.2 percent), and Chinese (2.5 percent) forming the largest subgroups.
- Mixed or Multiple Ethnic Groups: 5.6 percent of residents.
- Black, Black British, Caribbean, or African: 5.1 percent of residents.
- Other Ethnic Groups: 6.2 percent of residents.
Country of Birth Statistics and International Migration
Oxford functions as an international destination for academic researchers, healthcare professionals, and technology workers. The 2021 Census revealed that 35 percent of Oxford residents were born outside the United Kingdom, compared to a national average of 17.4 percent for England.
The top non-UK countries of birth recorded among Oxford residents include:
- Poland (accounting for 2.1 percent of residents).
- India (accounting for 2.2 percent of residents).
- United States of America (accounting for 1.9 percent of residents).
- Germany (accounting for 1.6 percent of residents).
- China (accounting for 1.5 percent of residents).
Linguistic diversity reflects this international migration. Office for National Statistics school data shows that across 67 state-funded schools in Oxford, 34.9 percent of pupils speak a first language other than English.
How Are Population and Housing Distributed Across Oxford Wards?
Oxford distributes its 165,200 residents across 24 administrative wards within a land area of 45.6 square kilometers. High-density residential zones concentrate in eastern wards such as Cowley, Headington, and St Clement’s, where student and multi-occupancy housing predominates.
High-Density Urban Neighbourhoods and Residential Zones
Oxford City Council divides the municipality into 24 administrative wards for local governance and population monitoring. Population density varies significantly across these geographic units due to historical development patterns and green space designations.
Wards with high population densities include:
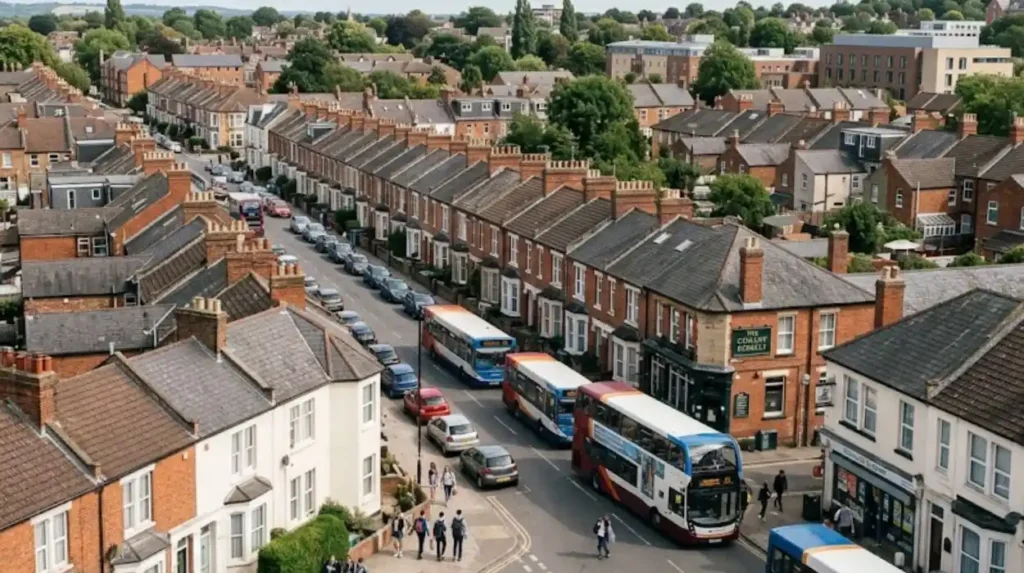
- St Clement’s: Characterized by narrow Victorian terraced housing, dense student accommodations, and commercial activity along Cowley Road.
- Cowley: Features high residential density combined with retail parks and industrial sites, supporting a diverse working-class population.
- Blackbird Leys: Located in the south-east of the city, this ward contains high-density social housing estates developed in the mid-twentieth century.
- Headington: Houses major medical campuses, including the John Radcliffe Hospital and Churchill Hospital, creating high population density driven by healthcare staff and university students.
Wards with low population densities include Wolvercote and Marston, which contain extensive floodplain green space along the River Thames and River Cherwell.
Household Composition and Housing Supply Constraints
The 2021 Census identified 55,200 occupied households within Oxford. The total number of households decreased slightly by 0.3 percent (-200 households) between 2011 and 2021, despite a 6.7 percent increase in the overall population over the same period. This divergence indicates an increase in average household size and higher occupancy rates per dwelling.
Household structures in Oxford break down into five main categories:
- Single-Person Households: 29.2 percent of all households (10.8 percent elderly single persons, 18.4 percent non-elderly single persons).
- Couples Without Children: 15.6 percent of households.
- Couples With Dependent Children: 18.0 percent of households.
- Lone Parent Households: 10.0 percent of households.
- Multi-Adult / Student HMOs: 27.2 percent of households, representing joint tenancies among unrelated working adults or students.
Housing tenure data shows that 47.1 percent of homes in Oxford are owner-occupied, 32.2 percent are rented from private landlords, and 20.7 percent are social housing rented from Oxford City Council or housing associations. Oxford maintains one of the largest private rented sectors in England.
What Are the Economic and Social Implications of Oxford Demographic Trends?
Demographic concentration of young adults and high population density create acute housing shortages, pushing average home prices to 12 times average local earnings. These population dynamics increase pressure on local transport networks, health services, and municipal council budgets.
Housing Affordability and Infrastructure Demands
The imbalance between population growth and housing supply makes Oxford one of the least affordable housing markets in the United Kingdom. ONS housing affordability data indicates that the median house price in Oxford stands at £560,880, which equals 12 times the average local workplace earnings.
High property prices generate significant economic impacts:
- Essential workers in health, education, and municipal services face high rent burdens or must commute long distances.
- Young families relocate out of Oxford City into surrounding districts like Cherwell, Vale of White Horse, and South Oxfordshire.
- Overcrowding increases within private rented dwellings and licensed HMOs.
Transport networks experience heavy pressure due to daily commuting patterns. Over 45,000 workers commute into Oxford daily from external locations such as Didcot, Witney, Bicester, and Abingdon. The arterial roads—including the A40, A34, and A4144—frequently experience morning and evening congestion. Public transit systems like Oxford Bus Company and Stagecoach Oxfordshire carry high passenger volumes to mitigate gridlock along major corridors.
Healthcare Planning and Public Service Provision
The combination of a large young student population and an aging long-term resident cohort requires targeted public health delivery. The NHS Oxfordshire Integrated Care Board (ICB) oversees healthcare resources across the city.
Health challenges across Oxford’s population include:
- Socio-Economic Health Inequalities: Life expectancy gaps between wards are pronounced. Men residing in the least deprived areas, such as Summertown, live an average of 15 years longer than men residing in the most deprived wards, such as Blackbird Leys.
- Student Mental Health Demands: University health services handle high demand for primary mental healthcare services among undergraduate and postgraduate students.
- Deprivation Concentration: 10 out of Oxford’s 83 Lower Layer Super Output Areas (LSOAs) rank among the 20 percent most deprived areas in England. In these areas, 25 percent of children live below the poverty line after housing costs are calculated.
Explore More Area Guide
Law Enforcement Operations Update Security Situation in Turbat
How Meteorologists Forecast Heatwaves and Extreme Heat Domes in Oxford
What Are the Future Population Projections for Oxford?
Official population projections from the Office for National Statistics forecast Oxford’s population to reach 170,000 residents by 2030. Spatial constraints enforce green belt protections, requiring surrounding Oxfordshire district councils to absorb thousands of overspill housing units.
Long-Term Growth Forecasts and Local Plan Targets
Population projections published by the Office for National Statistics anticipate continued population expansion for Oxford through 2035. Demographers project the population to reach approximately 170,000 residents by 2030 and exceed 173,000 residents by 2035.
The Oxford Local Plan 2036 sets municipal planning policies to accommodate demographic growth while protecting historic assets and environmental designations. The Local Plan identifies a total capacity for 9,612 new homes inside city boundaries between 2016 and 2036. Key development sites designated for residential density within Oxford include:
- Oxford North (Canalside): Mixed-use development providing 480 residential units alongside commercial science research space.
- Barton Park: Residential development providing 885 new homes in north-east Oxford.
- Osney Mead Industrial Estate: Long-term urban regeneration site planned for student accommodation and residential housing.
Regional Development and Overspill Housing Strategies
Because Oxford City Council cannot meet its assessed housing need of 16,000 additional homes within its tight administrative boundary, surrounding Oxfordshire local authorities entered into a binding duty-to-cooperate agreement. Surrounding districts committed to building 14,300 overspill homes targeted specifically at meeting Oxford’s unmet housing demand.
Surrounding district housing allocations include:
- Cherwell District Council: Allocating 4,400 homes north of Oxford near Kidlington and Begbroke.
- Vale of White Horse District Council: Allocating 2,200 homes south of Oxford near Abingdon and Botley.
- South Oxfordshire District Council: Allocating 4,950 homes east of Oxford near Wheatley and Culham.
- West Oxfordshire District Council: Allocates 2,750 homes west of Oxford near Eynsham.
These cross-boundary housing allocations ensure that while physical population growth within Oxford City remains constrained by the Oxford Green Belt, the functional Oxford metropolitan area will expand steadily over the coming decades. Oxford Daily will continue tracking demographic releases, census revisions, and local development policies to provide transparent coverage for the Oxford community.
What is the current population of Oxford, UK?
According to the Office for National Statistics (ONS) mid-2023 population estimates, Oxford has an estimated population of 165,200 residents. The 2021 UK Census recorded 162,100 people, showing continued population growth.